In this post, we are going to explore one of the smallest quadcopters that are available in the market: CrazyFlie and how we can use node.js, d3.js, socket.io and html5 to visualize the flight data. CrazyFlie is a nano quadcopter from Bitcraze, a swedish company, whose goal is to provide an open-source hardware design and firmware for developing small quadcopters.
It has 2 versions, the 6-DOF and 10-DOF both of which can be purchased from SeeedStudio. You can read about the specifications for both 6-DOF and 10-DOF versions here.
The CrazyFlie kit comes with CrazyRadio which is a USB dongle that allows you to send commands from your computer or Android device to the on-board receiver in CrazyFlie. They have a python library that can talk to the CrazyRadio and it uses the CRTP or CrazyFlie Real-Time Protocol to communicate to the CrazyFlie. They also have a GUI client written in PyQT where in you can visualize the flight data and view the console logs for debugging purposes.
Here’s a screenshot of the GUI client running inside the Bitcraze VM that runs Xubuntu.
Bitcraze VM is virtual machine image that includes all the tools, documentation, libraries and source codes needed to build the crazyflie firmware and the GUI client.
While browsing the web about CrazyFlie and CRTP, I came across this node.js control library for CrazyFlie! It’s called Aerogel. It’s still on its early stage but the good thing is the author has implemented the most difficult part of communicating to CrazyRadio and CrazyFlie using USB module and CRTP. The code looks really neat and well organized which helps a lot specially for a not-so-javascript-savvy person like me.
I forked and modified it a bit to fix some issues that I’ve encountered while creating the visualization. You can get the source code here.
Now that we have a way to talk to the CrazyFlie using Javascript, the only thing that we need to do is to expose the flight data to a client. One way of doing this is to use express.js We’ll run a local web server that talks to our CrazyFlie using Aerogel and then we’ll create a simple HTML page that will be served by the express.js web server.
First, we’ll setup our visualization app using express.js. One thing that I like about the latest version of express.js is the ability to generate scaffolding. All the necessary files (including css, javascript and route definitions) and directory structure will be automatically created for you.
$ express --sessions --css stylus --ejs myapp

create : myapp
create : myapp/package.json
create : myapp/app.js
create : myapp/public
create : myapp/public/javascripts
create : myapp/public/images
create : myapp/public/stylesheets
create : myapp/public/stylesheets/style.styl
create : myapp/routes
create : myapp/routes/index.js
create : myapp/views
create : myapp/views/index.ejs
index.ejs is where we need to create our visualization and app.js is where we write our code to talk to our CrazyFlie and expose the data to our client.
In app.js, we need to modify the code that creates the http server to include the initialization for our socket.io module.
var server = http.createServer(app);
var io = require('socket.io').listen(server);
server.listen(app.get('port'), function(){
  console.log('Express server listening on port ' + app.get('port'));
});
We’ll use socket.io so that we can easily send our updated flight data from our server to the client without having to do polling from the client side. This also makes the transfer of data from server to client as real-time as possible.
Next, we’ll setup and start our socket.io server and then we’ll listen to pre-defined events that will come from the client.
var mSocket;

io.sockets.on('connection', function (socket) {
  mSocket = socket;

  startCF();

  mSocket.on('command', function (data) {
    if(data.action == 'start'){
    	takeOff();
    }else if(data.action == 'stop'){
    	land();
    }
  });

  mSocket.on('disconnect', function () {
        console.log('Shutting down crazyflie...');
        bail();
    });
});
Here, we are listening for a command and disconnect events. For now, we only have a start and stop command that will put the crazyflie into take-off mode and land it respectively. Disconnect event will be fired-up when you either close the tab or your browser that runs the client.
For the flight data, Aerogel allows you to subscribe to particular telemetry group:
- stabilizer
- motor
- accelerometer
- gyro
- pm
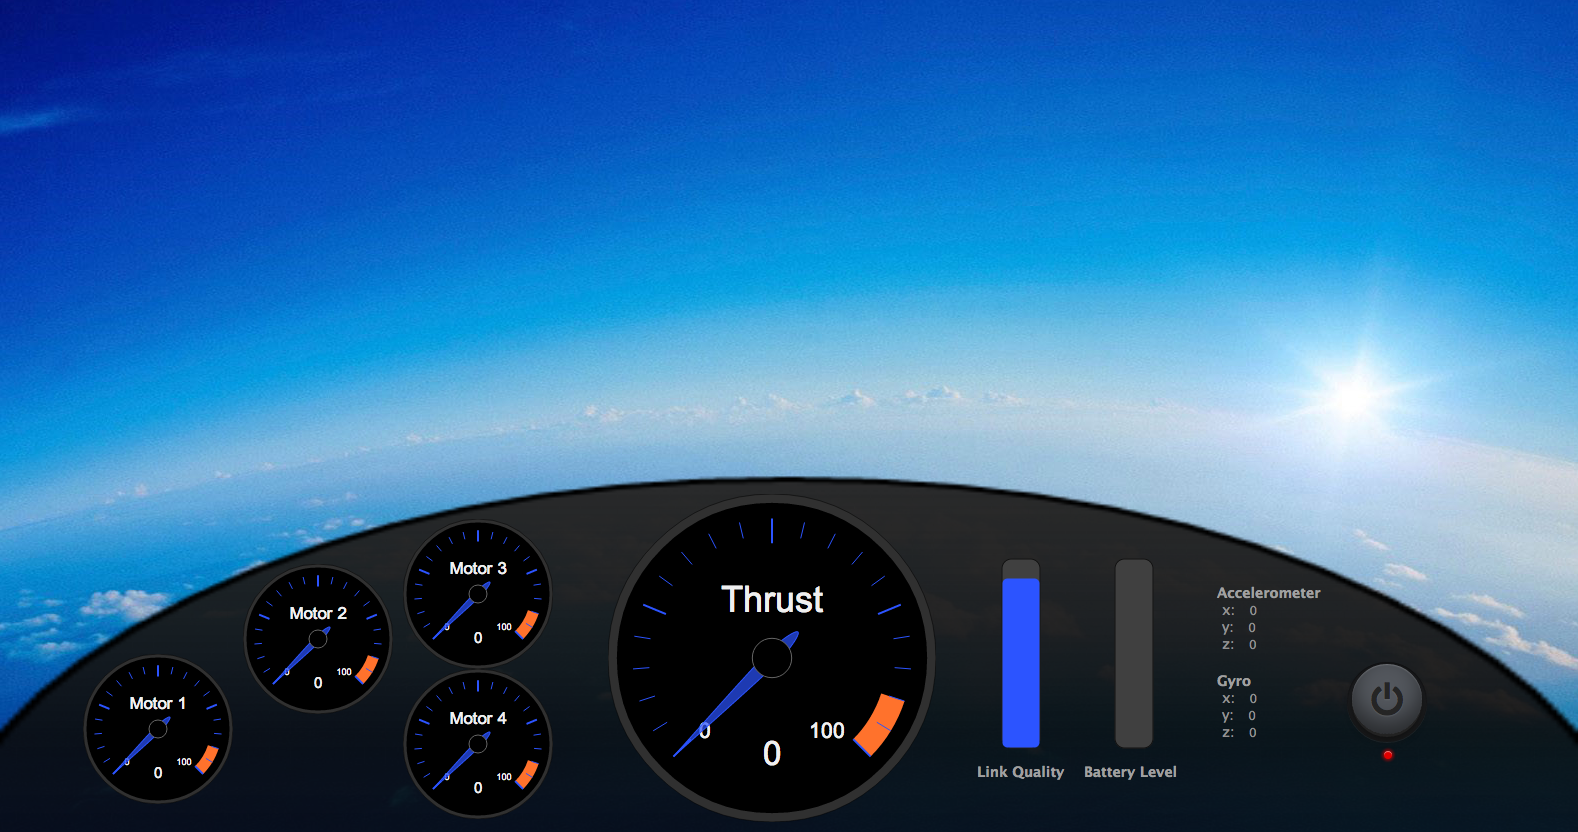
Stabilizer contains the pitch, roll, yaw and thrust data. Motor telemetry contains the thrust information for each of the 4 motors. Accelerometer and gyro contains the x, y and z values from the accelerometer and gyro sensors. PM contains information about whether crazyflie can fly as well as the current battery level.
Other information such as altitude and compass data will be available when the firmware exposes them but as of this writing, these data are still not available.
Subscribing to stabilizer data is as easy as:
copter.driver.telemetry.subscribe('stabilizer', handleStabilizerTelemetry.bind(copter));

function handleStabilizerTelemetry(data){
    if(mSocket){
    	mSocket.emit('stabilizer', data);
 	}

}
handleStabilizerTelemetry will be called everytime there’s a new stabilizer data received from crazyflie then we’ll just have to send a ‘stabilizer’ event down to our socket connection. On the other hand, a client can simply register for the stabilizer and other events to receive the data.
Here’s an example of code that listens to ‘stabilizer’ event:
socket = io.connect('http://localhost');
socket.on('stabilizer', function (data) {
    var pitch = data.pitch * Math.PI / 180;
    var roll = data.roll * Math.PI / 180;
    var yaw = data.yaw * Math.PI / 180;
 });
Now that we have the stabilizer data, we are ready to visualize it. In the next part, we’ll talk about more on the UI part where we are going to use d3.js and HTML5 Canvas to draw most parts of the UI.